We provide Market Technical Analysis online (apkid: apple.com.bulllabs.technicalanalysis) in order to run this application in our online Android emulator.
Description:

iPhone app Market Technical Analysis download it using MyAndroid.
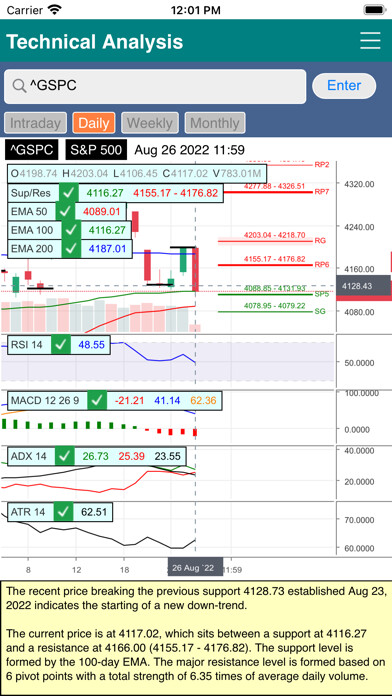
Find trends in various timeframes using pivot points (a.k.a.
peak-and-trough) methods to help with stock trading.
It identifies support and resistance levels using volumes, average volumes, pivot points, gaps and moving averages.
It incorporates traditional indicators - RSI, ADX, MACD, ATR and provides interpretations.
Analysis currently covers most stocks, ETFs, ADRs and indexes (more than 14,000 securities) trading on US & Canadian markets.
Initial version of the app starts with peak and trough analysis.
When a stock moves up, the pricing action does not go in up a straight line but consists of multiple serious of advances and declines, with the overall moves trending in the up direction.
Similarly, when a price comes down, the pricing action does not go down in a straight line but consists of multiple serious of declines and advances, with the overall moves trending in the down direction.
An upward trend is a successfully higher peaks and higher troughs, and a downtrend is a successfully lower peaks and lower troughs.
When a higher peak is followed by a lower trough or vice versa, there is no trend in the price movement.
After an uptrend is in place, the subsequent higher peaks and higher troughs confirm the original uptrend.
The analyzer gives report on the time and price when the trend is first identified and the number of times the trend is reconfirmed.
Pivot point analysis is also useful in giving an early signal of trend reversal.
As a long lasting trend movement enters into a period with no trend, it may be an indication of an end of the bull or bear run.
The App performs analysis in short (daily), medium (weekly) and long (monthly) timeframes.
It also performs intraday trend analysis using real time market data when the stock market is open.
The trend in one timeframe may or may not agree with the trend shown in another timeframe.
When they move in the same direction, it shows high confidence level in the underlying trend.
If the results contradict one another, it indicates some hesitancy and uncertainty in the movement.
In addition to trend analysis, the App also calculates Fibonacci retracement levels and shows them on the last two pivot points.
Fibonacci results may not show if the pivot points do not appear to form significant pricing reversal points.
V2.0 includes support and resistance level analysis.
In the daily timeframe, the tool gathers information based on trading volume and average volume from the last 30 days, pivot points and gaps from a certain periods from the past as well as some major EMA (exponential moving average) of prices to obtain the support and resistance level of the current price.
V2.1 includes RSI and ATR indicators and interpretations.
The RSI (Relative Strength Index) analysis identifies overbought and oversold conditions and divergence to the main price movements.
The ATR (Average True Range) analysis identifies normal price swing and stop loss levels.
These Indicators are drawn in separate areas under the main chart.
V2.2 adds ADX (Average Directional Movement Index) and DMI+ and DMI- in the chart and include ADX analysis to identify trend direction and trend strength.
V3.0 includes a new charting framework to support much more indicators planned in the upcoming releases.
Each indicator section can be minimized separately to make room for main chart and other indicator charts.
Minimized indicator areas still display time series values without showing the chart.
Indictors on the main chart can also be turned on or off individually for a cleaner main display.
V3.1 adds MACD (moving average convergence divergence) support.
MACD is a trend-following momentum indictor that shows the relationship between a fast and a slow period EMAs.
It helps with easily identifying the strength and momentum of the bullish and bearing trends.
V3.2 includes complete charts and analysis for Intraday, Weekly and Monthly timeframes.
V3.3 Includes Canadian stock markets.,
MyAndroid is not a downloader online for Market Technical Analysis. It only allows to test online Market Technical Analysis with apkid apple.com.bulllabs.technicalanalysis. MyAndroid provides the official Google Play Store to run Market Technical Analysis online.
©2025. MyAndroid. All Rights Reserved.
By OffiDocs Group OU – Registry code: 1609791 -VAT number: EE102345621.
